Global Securities Firms Regulatory Inquiry App
Bank of America Stock: Technical Outlook Prior To Q1 Earnings - Bank of America (NYSE:BAC)
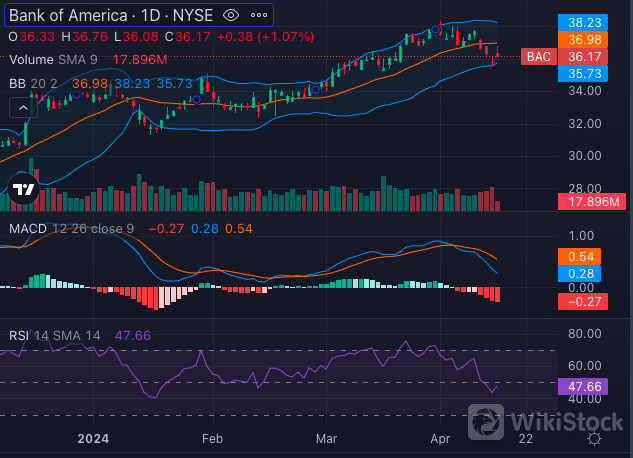
Chart: Benzinga Pro
The Moving Average Convergence Divergence (MACD) indicator stands at 0.28, further supporting a bullish sentiment. However, the Relative Strength Index (RSI) of 47.66 suggests that Bank of America is oversold.
The Bollinger Bands indicate a bearish sentiment. After treading in the upper bullish band for the past few months, Bank of Americas price has recently moved to the lower band, reinforcing the bearish sentiment. Overall, the technical setup appears more bearish than bullish currently for Bank of America stock.
Investors may want to wait for potential bullish opportunities for Bank of America stock.
Analysts Consensus Ratings
Ratings & Consensus Estimates:The consensus analyst rating on Bank of America stock currently stands at Overweight with a price target of $35.36. Recent analyst ratings on the stock from Jefferies; Keefe, Bruyette & Woods; and Evercore ISI Group, have an average price target of $39, with an implied 7.79% upside.
The upcoming earnings release for Bank of America has the potential to significantly influence trader sentiments. As market participants await the earnings numbers, they will likely weigh this data alongside the technical signals to determine the stocks trajectory in the short term.
BACPrice Action: Bank of America stock was trading up o.36% at $35.92 at the time of publication Monday.
Photo: Shutterstock
Market News and Data brought to you by Benzinga APIs
© 2024 Benzinga.com. Benzinga does not provide investment advice. All rights reserved.
Promoting the development of lithium and sodium in the new energy industry
More than 20 A-share companies will be at risk of delisting!
Is Xiaohongshu's major shareholder selling shares valued at 20 billion?
TikTok "refugees" move to Xiaohongshu. How long will this craze last?
Check whenever you want
WikiStock APP